


Follow us on
Braderie de Lille: What the footfall data reveals about your city's attractiveness
The Braderie de Lille lost 43% of its visitors in 2025. Here is what the data shows, and the concrete actions city managers should take before the next edition.
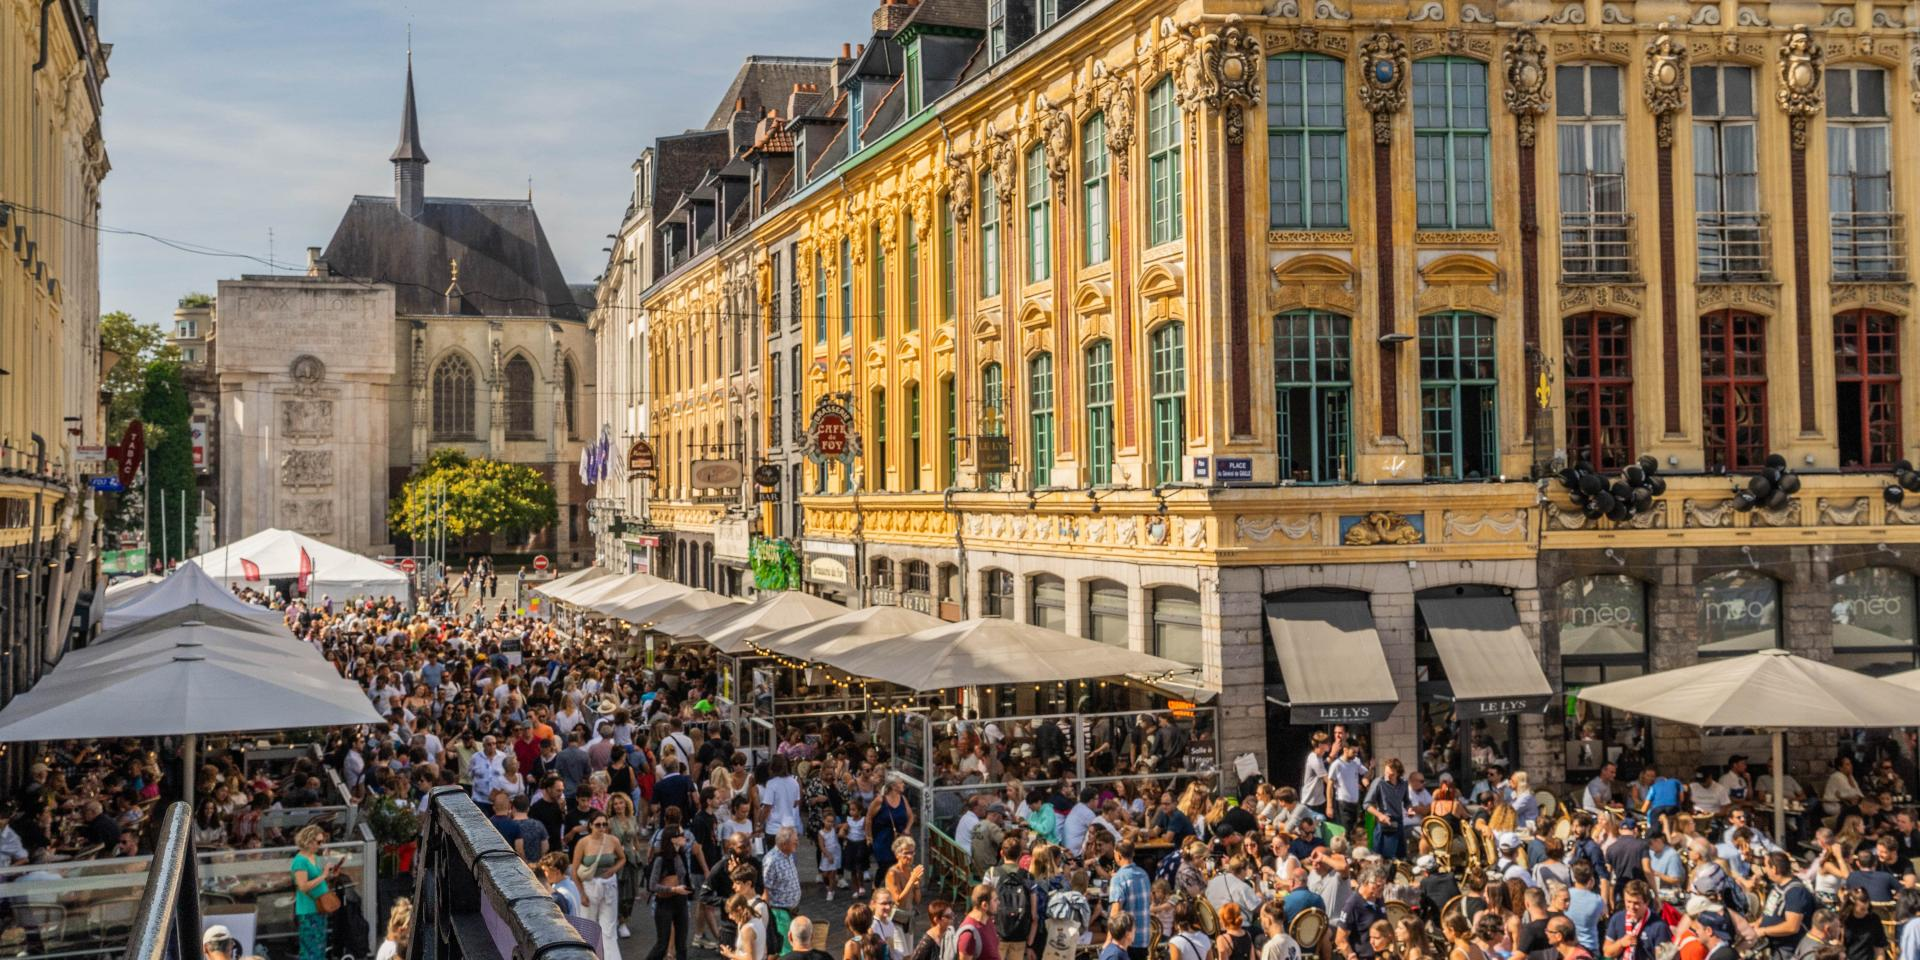
Every September, the Braderie de Lille transforms the city into the largest flea market in Europe. For elected officials and territorial directors, it is also one of the most visible tests of their city's attractiveness. When attendance drops by nearly half in a single year, the question is not whether to act, but where to start.
Using footfall data from Gini by Mytraffic, we analysed how the Braderie has evolved since its post-lockdown comeback in 2022. What we found is not a story of decline. It is a story of transformation, and one that every city managing a major public event can learn from.
What does the 2025 attendance drop actually mean?
The 43% drop in 2025 does not signal the end of the Braderie. It signals the end of the post-lockdown rebound, and the start of a new baseline that requires active management.
Between 2022 and 2024, attendance grew steadily as the event recovered from two years of pandemic cancellations. That recovery curve was always going to flatten. What matters now is understanding why 2025 marks a sharper correction than expected, and whether the causes are structural or cyclical.
Footfall data gives city managers two distinct lenses for this question. The first is raw volume: how many unique visitors entered the perimeter of the event. The second is composition: who those visitors were, where they came from, and how deeply they explored the territory.
Raw volume declining is never a comfortable signal to present to elected officials. But it is worth noting that post-pandemic event recovery across Europe has followed an uneven pattern. According to the European Cities Marketing benchmarking report (2024), urban tourism and event attendance in major European cities recovered to 2019 levels on average by 2023, but then saw corrections of between 15% and 35% in 2024-2025 as exceptional pent-up demand normalised. A 43% drop from a 2024 peak that was itself inflated by post-lockdown enthusiasm is a different problem than a 43% structural decline from a stable baseline.
The practical implication for city managers: do not present this figure to stakeholders without the trend context. The 2022-to-2024 growth trajectory is part of the same story.
Who is still coming to the Braderie, and why does it matter?
In 2025, 40.6% of Braderie visitors came from Lille itself, the highest local share since 2022. The event is becoming more anchored in its home city, and less dependent on regional draw.
This shift matters strategically. In 2022, as the event reopened after two years of absence, visitors from surrounding cities and regions made up the majority of attendance. The Braderie had accumulated demand from people who had missed it. By 2025, that reservoir has emptied. What remains is the local core.
For city managers, this is a double signal. On one hand, local loyalty is the most durable foundation for any public event. Residents who attend year after year are the audience that keeps an event alive between editions, generates word-of-mouth, and embeds the event in urban identity. On the other hand, an event that loses its regional draw risks losing its status as a destination, which eventually affects hotel occupancy, restaurant revenue, and the commercial argument for businesses to set up along the route.
The strategic question is not "how do we get locals to attend" but "how do we rebuild regional and national reach without hollowing out the local character that makes the Braderie worth attending in the first place."
The data points to one immediate action: segment the communication strategy. Locals need a reason to rediscover the event, which means showcasing new routes, new vendors, and new neighbourhood anchors. Regional visitors need a reason to make the trip, which means positioning the Braderie as a destination experience, not just a flea market.
Are visitors becoming more or less engaged with the territory?
Even as total attendance fell, the visitors who came in 2025 explored the Braderie more deeply. Penetration rates within the event perimeter among visitors from nearby cities increased across the board. The audience is smaller, but more committed.
This is one of the most useful findings for city managers, because it reframes the 2025 data entirely. A large but shallow crowd is a different urban management challenge than a smaller but deeply engaged one. Understanding which dynamic you are dealing with changes everything from event layout to vendor allocation to street activation strategy.
What penetration rate actually measures
Penetration rate in this context measures the proportion of visitors who moved through a significant portion of the event's geographic footprint, rather than concentrating in one entry point or one street segment. A visitor who parks near the Porte de Paris, walks two streets, and leaves has a low penetration rate. A visitor who crosses multiple neighbourhoods, visits the secondary routes, and spends several hours has a high one.
The Braderie covers an unusually large surface area for a single-day event, which makes penetration rate a particularly meaningful indicator. Some editions have historically suffered from bottlenecks where the same central streets absorb the majority of footfall while peripheral vendor zones remain empty. High penetration means those peripheral zones are working.
What the 2025 data shows in practice
Visitors from nearby cities, who in 2022 and 2023 tended to concentrate around the main central route, explored significantly further in 2025. This suggests two things. First, the visitors who made the trip in 2025 were genuinely motivated, not casual attendees swept along by the novelty of the event's return. Second, the event's layout may have improved, either through better signage, a more distributed vendor placement, or programming that rewarded exploration.
For city managers, a rising penetration rate among a declining audience is a strong argument for investing in route design and peripheral activation rather than simply trying to inflate headline attendance numbers. Depth of engagement generates more commercial value per visitor, creates better conditions for street vendors in secondary zones, and produces better footage and content for post-event communication.
How to act on this in the next edition
Three specific interventions follow from this data:
The first is route architecture. Gini by Mytraffic's footfall data can identify which street segments had significantly lower penetration than average, and which acted as natural waypoints that drew people further into the territory. This makes it possible to design the next edition with deliberate "pull points," whether a specific vendor type, a food zone, or an activation, placed at the point where pedestrian flow typically drops off.
The second is vendor placement. In most flea markets, the most desirable pitch locations cluster around high-traffic central streets. But if footfall data shows that visitors who reach the secondary zones spend more time and return more often, there is an argument for incentivising higher-quality vendors to take peripheral spots. This changes the calculus for vendors who have historically competed for central placement.
The third is communication timing. Footfall data broken down by hour shows when penetration peaks and when it collapses, which tells you exactly when to push mobile notifications, social media content, or on-the-ground activation to redirect flow into underperforming zones. This is the difference between reactive crowd management and proactive territorial direction.
Which demographic is driving the Braderie's resilience?
The share of visitors aged 15 to 29 increased consistently from 2022 to 2025, across all genders. The Braderie is attracting a younger audience, and this is a strategic asset, not a footnote.
For cities worried about the long-term relevance of a traditional event in an increasingly fragmented attention economy, this is genuinely good news. A younger audience base means the event has cultural currency beyond nostalgia. It means the Braderie is competing successfully for the weekend time of people who have access to a wider range of experiences than any previous generation.
The practical implication is that communication strategies designed for the core historical audience may be doing less work than assumed. Formats that work for a 45-year-old regular attendee, press releases, print guides, radio spots, do not move the 15-to-29 segment. What moves them is short-form content that shows the experience rather than describing it, peer recommendation, and the kind of social media presence that makes the event feel like the place to be, not the place you go out of habit.
Cities that act on this demographic signal now will find it significantly easier to maintain attendance over the next decade. Those that do not will face a harder rebuilding task later.
How can a city use this data to act before the next edition?
The gap between a successful 2026 Braderie and a second consecutive year of decline will be determined by decisions made in the next six months, not in the week before the event.
Here is a concrete planning sequence based on the four data signals above.
Now, in the post-event window: Use footfall data to run a full debrief on the 2025 edition. Map which street segments underperformed their 2024 equivalent, identify the hours where attendance dropped fastest, and calculate the actual penetration rate across the event's different zones. This analysis takes days with the right data, not weeks.
Three months out: Redesign the vendor map and route architecture based on that debrief. Brief the communication team on the two distinct audiences, locals and regional visitors, with different messaging frameworks for each. Commission content specifically for the 15-to-29 segment, ideally involving creators who already have that audience rather than trying to build it from scratch.
Six weeks out: Launch regional targeting campaigns with a specific call to action. Not "come to the Braderie" but "here is the route, the vendor, and the neighbourhood you have not visited yet." Give people who have been before a reason to see it differently.
On the day: Use live footfall monitoring to identify underperforming zones in real time and redirect flow before it becomes a problem. This is exactly what Gini by Mytraffic's SmartMonitor makes possible, tracking pedestrian movement across the territory as the event unfolds.
This is not a radical reinvention of the Braderie. It is applying the same rigour to event management that the best retail and commercial real estate operators already apply to their locations every day.
What metrics should city managers track to measure territorial attractiveness?
Raw attendance is the least useful metric for understanding a city event's true performance. The five indicators below give a far more complete picture, and each one is measurable with footfall data.
This section matters because the way a city measures an event determines the decisions it makes about that event. If the only number that lands on the mayor's desk is total visitors, every strategic conversation becomes about inflating that number. The result is decisions that optimise for headline figures rather than genuine territorial value.
Here is a framework built specifically for public sector use, applicable to the Braderie and to any city-organised event or initiative.
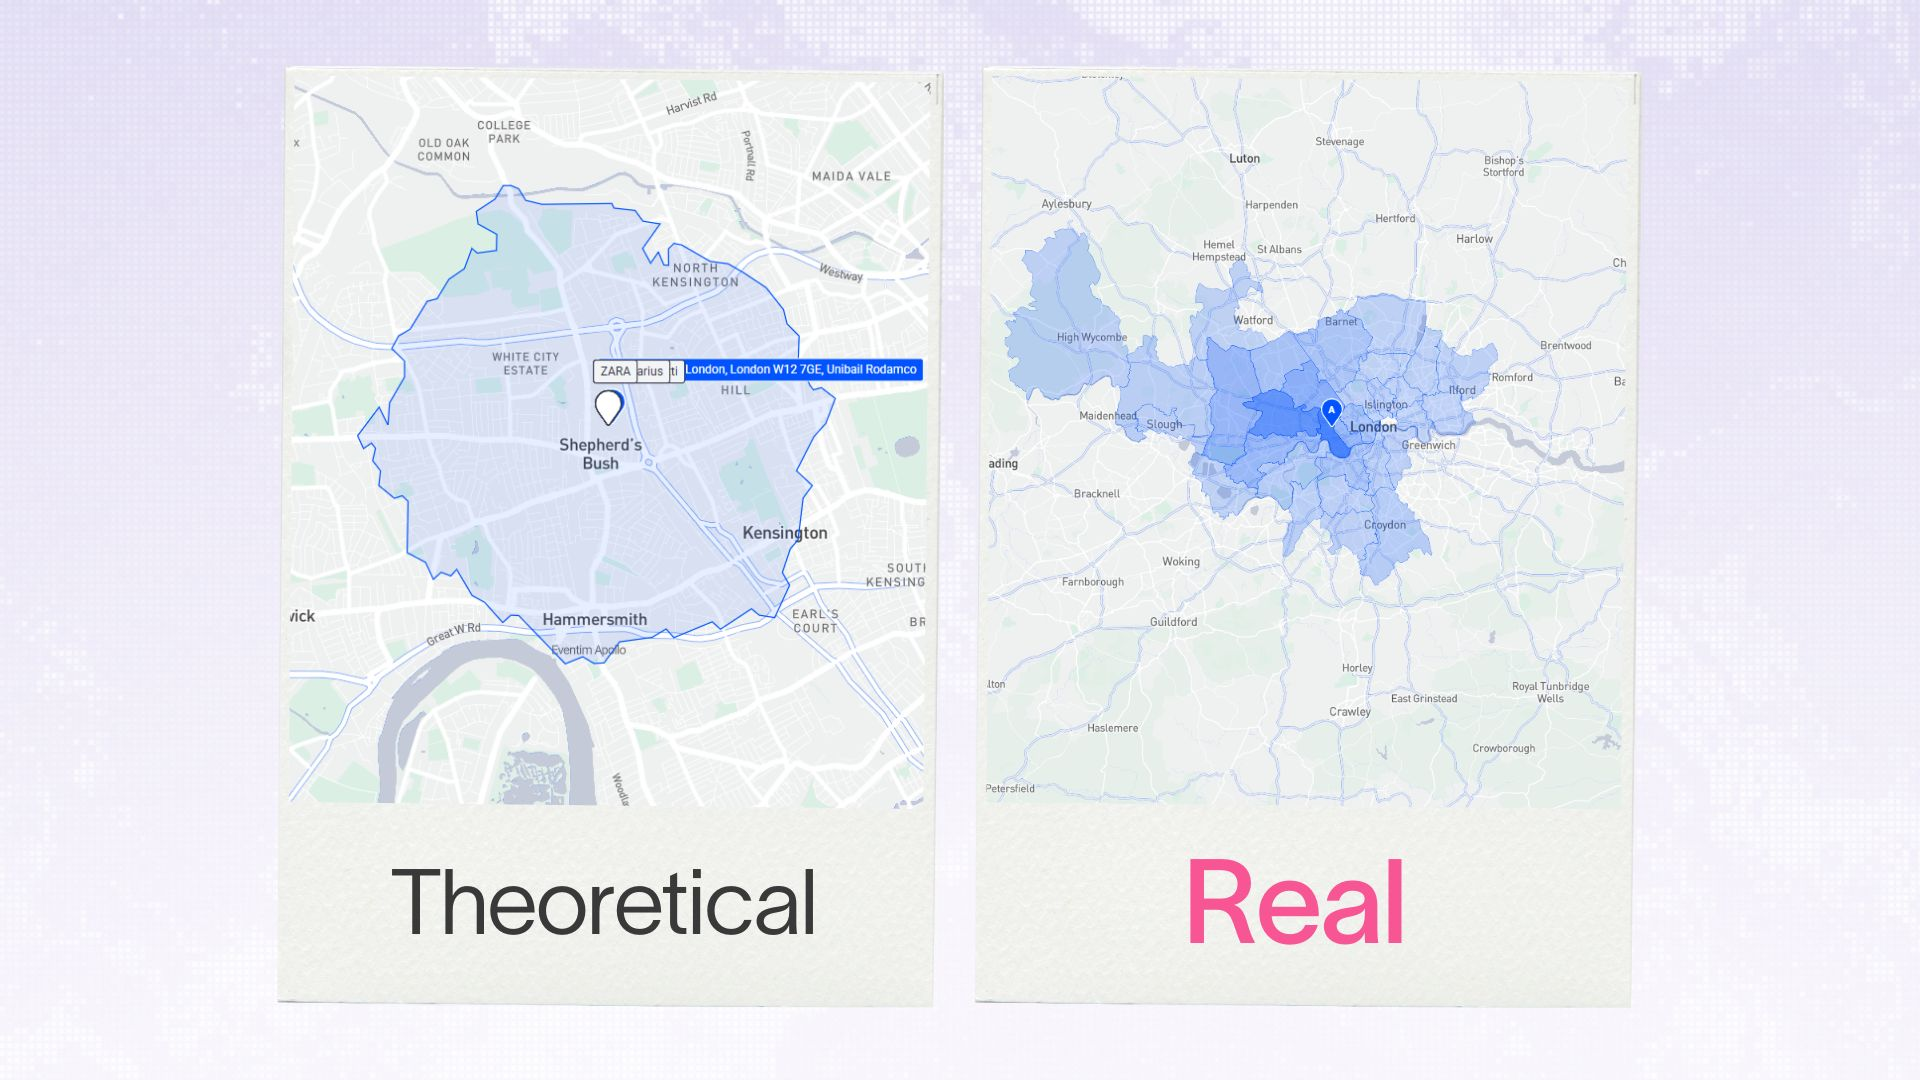
1. Catchment radius and visitor origin
Where visitors come from tells you far more than how many came. A useful breakdown splits the audience into at least three geographic rings: city residents, visitors from the wider metropolitan area (typically within 60 minutes of travel), and visitors from further afield. Each segment has a different economic profile and a different relationship with the city.
City residents contribute relatively little in hotel revenue or transport spend but provide the social density and ambient energy that makes an event feel alive. Regional visitors bring spending on accommodation, restaurants, and transport that multiplies the economic impact of the event well beyond the direct footfall figure. National and international visitors are the highest-value segment for city attractiveness, but they require a different communication investment to reach.
A city that knows its catchment radius can set specific targets for each ring in the following edition. This is the difference between hoping for more visitors and knowing which geography to activate.
According to a 2023 study by the Centre for Cities on urban event economics, events that actively track and report catchment data are 2.4 times more likely to secure sustained public funding, because they can demonstrate territorial return on investment rather than just cultural value.
2. Penetration rate by zone
As described earlier in this article, penetration rate measures how deeply visitors explore the event's geographic footprint. For city managers, this translates directly into vendor satisfaction, commercial activation effectiveness, and the equitable distribution of footfall-driven revenue across different neighbourhoods.
A practical benchmark: any zone with a penetration rate below 40% of the event's average warrants specific intervention in the next edition, whether through vendor incentivisation, signage, programming, or route redesign.
Cities should also track penetration rate over multiple editions to identify whether it is improving or declining. A declining penetration rate with stable headline attendance means the same streets are getting busier while others empty out. This is the precursor to vendor churn in peripheral zones and the gradual shrinkage of the event's actual footprint.
3. Dwell time and return visit rate
How long visitors stay is a direct proxy for the quality of their experience. Gini by Mytraffic measures dwell time by tracking how long devices spend within the event perimeter, and can distinguish between first-time visitors and those who have attended in previous years.
A rising dwell time alongside declining total attendance, as appears to be the case with the 2025 Braderie, is a signal that the event is becoming more experiential and less transactional. Visitors who stay longer spend more, generate more content, and are more likely to return. This is the foundation of a sustainable event, not a failing one.
Return visit rate is the single best indicator of long-term territorial loyalty. An event where 60% of last year's attendees come back has a fundamentally different strategic position than one where the audience turns over completely each year. The first can plan with confidence; the second is always starting from scratch.
4. Demographic profile evolution
Age and gender data, tracked consistently across editions, reveals whether an event is broadening or narrowing its audience. The Braderie's growth in the 15-to-29 segment is a positive signal, but it should be tracked alongside the retention of older cohorts. An event that gains young visitors while losing its established audience is not diversifying; it is migrating.
The most resilient events are those with multi-generational attendance, because they embed themselves in city life rather than depending on a single cohort's continued interest. The Braderie has that potential. Tracking demographic evolution each year is the mechanism that makes it possible to act when a cohort starts to drift.
5. Commercial activation impact
The last metric bridges the event itself and the city's broader economic geography. Footfall data from Gini by Mytraffic can measure not just attendance at the event, but the downstream impact on surrounding commercial zones: did restaurants and bars within a 500-metre radius see elevated footfall during the event? Did visitors explore adjacent streets? Did the event generate overflow activity in neighbourhoods it was not directly designed to serve?
This metric matters for two reasons. First, it is the most compelling evidence for the event's contribution to city economic life when presenting to businesses, investors, or funding bodies. Second, it identifies commercial zones that are positioned to benefit from the event but are not currently capturing that opportunity, either because of poor signage, an unattractive offering, or simply because they are not included in the event's communication materials.
According to JLL's European Retail Outlook (2024), cities that can demonstrate quantified commercial spillover from public events secure 30% more private co-investment in territorial activation than those that present attendance figures alone. The data infrastructure to produce that evidence exists. Using it is a strategic choice.
Frequently asked questions
How do you measure the footfall impact of a public event like the Braderie de Lille?
Footfall impact is measured by counting unique visitor devices within a defined geographic perimeter during the event period and comparing that figure against equivalent non-event periods. Tools like Gini by Mytraffic can segment this data by visitor origin, age, dwell time, and penetration rate across different zones within the event footprint.
What caused the 43% attendance drop at the 2025 Braderie de Lille?
The most likely explanation is the normalisation of post-lockdown demand. Attendance surged between 2022 and 2024 as pent-up demand released, creating an inflated baseline. The 2025 figure likely reflects a more sustainable level of attendance, though the specific drivers, weather, competing events, travel costs, should be investigated using origin data and visitor surveys before drawing firm conclusions.
How can cities demonstrate the return on investment of major public events?
The most credible ROI framework combines footfall data (attendance volume, visitor origin, dwell time) with commercial data (restaurant and retail footfall in surrounding zones), accommodation data (hotel occupancy during the event period), and demographic data (age profile, proportion of first-time visitors). Gini by Mytraffic provides the footfall and demographic layers; cities can combine this with their own commercial and accommodation partners' data.
What is territorial attractiveness and how is it measured?
Territorial attractiveness refers to a city or area's capacity to draw visitors, residents, businesses, and investment. For events specifically, it is measured through the catchment radius of visitors, the demographic breadth of the audience, the commercial activation generated by event footfall, and the proportion of visitors who return in subsequent editions. These metrics, tracked consistently over time, give elected officials and city managers an evidence base for decisions about event investment and territorial strategy.
To resume
The 2025 data is not a verdict. It is a briefing. The Braderie de Lille remains one of the most recognisable events in French urban life, with a younger and more engaged audience than it had three years ago, and a local core that continues to show up year after year.
What the data asks for is a city that responds to it rather than filing it away. The tools exist to map exactly where visitors went and did not go, to identify which demographic signals require a change in communication strategy, and to track whether the interventions made for the next edition actually moved the metrics that matter.
With Gini by Mytraffic, that analysis does not require a months-long consulting project. It is available on the platform, edition by edition, zone by zone, cohort by cohort. The cities that use it will make better decisions about their events and their territories. The ones that do not will keep making the same decisions and wondering why the results keep shifting.
The Braderie deserves better than gut feelings. So does every city event that shapes how a territory is experienced, remembered, and chosen.